Friday, 29 April 2011

Financials are sneaking up (Ichimoku breakout for FAS)

Dear Readers, the financial sector is moving higher. It looks like there could be a Ichimoku breakout for FAS on the cards. What is an Ichimoku beakout? A move out of the clouds would mean that a new trend is possibly in place. Traders using the Ichimoku Cloud system would start to accumulate/buy stocks that are breaking out of the Ichimoku Clouds as depicted in the Direxion Daily Financial Bull 3X ETF (FAS) chart below (click on chart to enlarge). Proper position sizing are used as one can never know if the breakout could be a failure and Ichimoku traders would add to or average up their holdings at even higher price as the stock price moves up. Scary isn't it? Its a mechanical trading style. Stop loss would be moved up to limit losses or to secure their profits.

Ichimoku Clouds is primarily a trend-following system. The rationale is to buy high as that means that the stock is showing strength and can only go higher from the buy point. A move out of the clouds would mean that a new trend is possibly in place. Some famous trend followers are Ed Seykota and John W Henry (current owner of Liverpool Football Club).


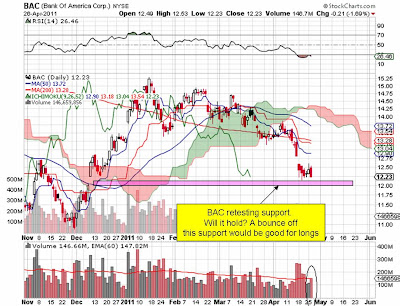
Next we look at everyone's favourite stock, Bank of America (BAC). BAC made a higher high and a higher low on its daily candlestick during trading on Thursday. It bounced off its support on a successful retest. This is a good area to accumulate long position as indicated in the Wyckoff method of technical analysis. We should see BAC moving higher from here.


Good luck to all !


Thursday, 28 April 2011

Can AIG break its descending trendline on 15min chart?

Could this be a double bottom on the 15min chart for AIG? For a double formation to happen, AIG needs to break $32 with volume and stay above it. Will it break?


BAC 15min chart - So close to breakout

BAC is so close to a breakout on its 15 mins chart. A symmetrical triangle in being formed. Will it go up or down?


Wednesday, 27 April 2011

BAC - Technical Analysis

Adopting A Flexible Mindset - A Tale of 2 Traders

Adopting a flexible mindset is absolutely crucial in our learning journey as traders. Traders who are "wishy-washy" tends to better than traders who are too rigid and fixated towards their trades.

Let's do a case study and go back to Oct 2010 where price action for BAC was at the $13 support level. Here's the story: Trader A and B both planned to initiate a long position at the $13 level as the general market condition was good. The Dow Jones index was also rising. Thinking that the $13 support would hold, Trader A initiated a long trade in BAC at $13. Lo and behold, BAC began to break through the $13 support. Trader A was so fixated in his thoughts on his long trade and refused to believe the fact that he was wrong and began to average down instead of cutting his losses at his pre-determined stop loss price of $12.95.

On the contrary, Trader B was flexible in his thoughts and had adopted a "I am going to be wrong most of the time" mentality and had a plan in place for the different possible scenarios. Instead of being over fixated on his long bias when the market broke through $12.95 taking out his stops, he understood that the market was telling him that he was on the wrong side of the trade and Trader B immediately changed sides and started shorting BAC as the stock price eventually went down to as low as $12.15.


Trader A fought the market all the way down and refuse to believe that he was wrong while Trader B embraced uncertainly and risk by adopting a flexible mindset which allowed him to turn a losing trade into a totally new market opportunity/trade and most importantly, ended up in the green. I am sure many of us here have faced such situations before. Instead of moaning about such trades, we might as well be mentally prepared for the different scenarios which could possibly take place before placing our trades and also respecting what the market is trying to tell us instead of fighting the tape.

Remember my friends, the market is never wrong!


Monday, 25 April 2011

Wyckoff Method of Technical Analysis - BAC (Part 2)

Dear Readers, do you still remember this earlier post on "Wyckoff method of technical analysis on BAC" ?

It suddenly dawned on me that BAC is back at its original "Last Point of Support" on its daily charts. I have many friends who are interested in buying BAC for the long term and this could be a good entry with stop loss, of course. However, it shoud also be very interesting to see how would BAC react at its near term resistance of $12.80.

Last Point of Support (LPS): The ending point of a reaction or pullback where support was met, also known as a retest of support where long position can be initiated or to add to profitable ones.


Who is Wyckoff and what is his method of technical analysis?
Richard Wyckoff, one of the great traders in his days, identified trading ranges as places whereby accumulation and distribution develops to build a cause for the subsequent change of trend in movement of price actions. Trading range are places whereby there are equilibrium between supply and demand and if judged correctly, would allow traders to profit form the magnitude of the move within and out of trading ranges.

Saturday, 23 April 2011

Time to add to Renesolar (SOL)

It is time to buy SOL according to the chart patterns if it clears $9.48 next week. The weekly and daily charts are in "sync". Click on charts to enlarge.  
Target : $12.

Daily Chart - SOL


Weekly Chart - SOL


And now.. blowing up the last candlestick on weekly charts for SOL. Looks promising.. isn't it?


Mighty Silver - Parabolic

Silver is going parabolic. The combination of early short sellers scrambling to cover their shorts and late buying by the public are pushing Silver to dizzy highs. Media reports everywhere are talking about the massive silver bull run and this will bound to draw in public interest. We'll need a blow-off top to suck all buyers in and to kill off all early short-sellers before the sell-off can begin. Nothing goes up forever and when the selling off begin, it could get nasty. For now, the silver bulls will have their day.


Friday, 22 April 2011

Is this the bottom for AIG ?

America International Group has been on a downward spiral ever since the start of 2011 and it has been one hell of a downtrend on hindsight as the stock had fallen from its high of $52 to its current $32. Its a freaking one hell of a drop in 4 freaking months. The question now is whether the bottom is already in for AIG? I said its very highly possible. One could go long here with a stop loss at $31.75. Next support for AIG is at $30.

Let's take a look at its hourly (60 min) chart. Stock is trying to have a go at breaking its downtrend line on the 60min chart. Do also note that the stock price has also made a higher low at the bottom channel of the symmetrical triangle. Breakout traders would normally wait for the the stock price to break upwards before piling in. If you are looking for confirmation, AIG is definitely "not there" yet.

AIG 60 minute chart (Click on chart to enlarge)


Let's take a look at its daily chart. Could this be the start of a consolidation? One could also be looking at a bounce trade with immediate resistance at AIG's 200day MA. Note that trading hours are still not over yet at time of post.


Lastly, let us take a macro view using the weekly chart. While the week is not over yet at time of posting, one could see that price action for AIG is now resting on the Ichimoku Cloud support at $32. This is a very strong and significant support for Ichimoko traders like me. This could be the area where AIG could bounce. Weekly charts are powerful. This is the chart which lead me to the deduction that AIG's bottom might be somewhere around this area! Could be... possibly... and again, do use stop loss.  =)


 Good luck and happy holidays to all !

Disclaimer: I have just nibble at some shares of AIG today for the long term. 


Mystery of the Banking sector & what the Dow Jones Index is possibly trying to tell us

Dear readers, the Dow Jones index showed remarkable strength on Wednesday when it gained 188pts on high volume. The market has shown its hand. What had looked like a double top formation brewing a just a few days ago was banished aside by the bullish market. At the moment, it is trying to tell us that the market wants to go higher and the catalyst could be the banks (ok, this is a huge COULD). While the banks are not moving higher yet, the wave of selling could be over.


If the Dow had wanted to drop further, the banks could be the sector to lead them down. What's an economy recovery without the banks? While i am initially hesitant to place my long bets on the financials, the overall market sentiment have somehow convinced me to take this trade. The financials had lagged the overall market big time and if they could wake up from their slumber, this could be their time to steal the limelight by leading the overall market even higher.

Let's take a look at the stock of the supposedly weaker Bank of America (BAC). One thing that i could detect from this stock chart is that selling has subsided for BAC. Note the lower volume and the narrower price spread as of today. Trading hours are still on and do note that we have to wait for the closing for confirmation as we are using the daily charts. If the Dow Jones want to go higher, the financial sector could be the missing puzzle in this mystery.


FAS - Financial barometer:  FAS is displaying strength at this moment as the stock had made a higher high after filling the gap yesterday. I was expecting this ETF to come back down after filling the gap but the price action of FAS showed strength and indicated that it wants to go higher at this moment. While it has yet to move back up the trend line which it fell through last week, perhaps things could be finally looking up for the financials. Is this their revival which all of us are waiting for?  I say: go place your bets now!


Always trade with stop loss!

Tuesday, 19 April 2011

Silver - Hanging man bearish reversal pattern spotted

I was stopped out of my short-silver trade the last two times round. And i here i am today taking the trade again the third time on the basis of a hanging man bearish reversal candlestick on high volume for Silver ETF (SLV). This will be a trade with a tight stop loss just below the low of the hanging man. While a hanging man pattern does not mean that it is a short, but it does appears on an uptrend increase the probability of that the trend might be changing. And remember, trading is a probability game. Could this be the top for Silver? Catching the top dollar has always been the most expensive!!


Remember to always trade with stop loss!


Contrasting fortunes: Banks and Casino stocks

The Dow Jones shed 140 points on Monday and is just nesting at the 50day MA now. It needs to close above the 12272 mark to show that the uptrend is in place or we could see more selling taking place. This could also be a double top formation for the Dow. I would not recommend going long at this moment in time until we see the Dow at least displaying some strength. Be in cash position and wait for the market to show its hand.


The banking sector looked weak. Any rally should be sold until selling has subsided. Some signs to look for would be low volume and narrow price action.


Bank of America (BAC) gaps down on high volume.


Our financial barometer broke its trend line yesterday when it gap down. This could trigger more selling if it fails to get back above its symmetrical triangle chart pattern. Not looking good. Either be in cash or shorting the market at this moment.


Let's take a look at JP Morgan as its stock price experienced a huge volume sell off. Its stock could make an attempt to fill the gap and retest the lower channel of the trend line to confirm the weakness if it fails to get back above into the triangle chart pattern.


Casino stocks are experiencing remarkable strength despite the weakness in the overall general market. I am impressed.

Las Vegas Sands


Melco Crown Entertainment (MPEL) - Strongest of the pack


MGM Resorts - Weakest of all casino stocks


Have a good day!

Monday, 18 April 2011

The Importance of Cutting Loss


Cutting loss is an essential risk management tool for our long term health as traders. If you lose your capital in the markets, you are as helpless as a soldier without any fire power (bullets) in the middle of a war.

By not taking the loss when it is small, we are allowing the market to dictate our emotions and more often than not, we’ll lose control of the situation when the losses against us are too much to bear. And at that moment after you decide to sell and take your huge loss, you end up selling your stock right at the bottom as the stock price rebound.

You know that you are losing control of the situation when you find yourself hoping that the market would reverse direction and move higher back to your original purchase price. This is what they call “hopium” for traders. You know you are on “hopium” when your losses are too huge for you to cut. At that moment, a trader can only hope that he could turn back the clock and had taken his losses when it is still small. Never lose control of the situation.

Buying insurance
Many a times, after we cut our losses, the stock price would tend to bounce back after the market makers shake out the sellers of the stock. Take this as your insurance fees. If you lose $200 and the price comes back up, you can always re-purchase your stock at a higher price. This $200 would serve as your insurance fees. So, what if you do not like to place stop loss orders and dislike “paying” for this type of insurance?

Scenario: Trader A placed his trade with a stop loss of $200 while Trader B chose to trade without a stop loss. The stock was then hit by a wave of selling and the price moved lower through Trader A’s pre-designated stop loss price and Trader A was promptly stopped out for a loss of $200. What about Trader B? He chose not to pay for insurance and could only watch as his stock price moved lower as the stock broke through a series of support level and he is now $2000 in the red instead of the small loss of $200 which Trader A took for this trade. Trader A in the meantime after getting stopped out even turned bearish and shorted the stock on the way down while Trader B could only lick his wound and watch as his capital is stuck in the stock. In extreme cases, it might take the stock years to come back up to its original high.

Of course, one might argue that the stock market has the tendency to go up instead of down over time. However I would like to point out that it is the stock market index that is going up over time. Weak companies in the index would be replaced with companies which are healthy and robust. One extreme case was Enron in 2001 when its share price plunged from $80 in January 2001 to less than $1 in late December 2001. Enron was then part of the S&P 500 index and was eventually declared bankrupt. It was duly replaced by another healthier company. And yes, you guessed it, the S&P 500 then climber higher 3 years later.


Sunday, 17 April 2011

Weekend updates - Dow Jones & Banks

The Dow Jones Index showed strength on Friday and managed to break Ichimoku Cloud's Tenkan line with volume as it bounced off the 50day MA as it looks to resume its current uptrend.


As for the banks, they have yet to move in tandem with the index. We should be able to see the Dow breaking new highs when the bank stocks wake up from their slumber. Its hard to see the economy improving and the banks not being part of it. Let's look at the overall barometer of banks via the Direxion Financial bull ETF. This ETF tracks bank stocks. FAS is now at crucial support. Will it hold? Banks are on my watchlist now. Currently stalking BAC and FAS and will be looking to make my purchase if they manage to hold their respective support area.

FAS - (Click chart to enlarge)


JP Morgan - (Click on chart to enlarge)


BAC - (Click on chart to enlarge)


Thursday, 14 April 2011

I hope I am not being too PARANOID !!!

Something just doesn't felt isn't right... Look at the daily chart of the Dow Jones Index (Click to enlarge chart). A break of the neckline will confirm the double top. Long way to go however, one can take note of the mental stop at Ichimoko support at 12003 points. It is of course too premature to make a call for a double top.

Recommendation: Go to cash position! We can always buy back our shares but losses are normally very hard to reverse. I am just reporting what i am seeing now on charts. (Click on chart to enlarge)


What's more.. JP Morgan reported earnings yesterday and beats expectations but its stock sell down on above average volume. Not a good sign. Charts never lie.. remember to Trade What You See! See chart below (Click to enlarge). Nonetheless, i am now in cash position after I was stopped out of my BAC trade.


Some more clues:
Remember the bullish triangle on weekly chart of MGM i posted about 1 week back? Upon zooming in onto the individual candlestick, this is what we see: (Click to enlarge)


This is what we see on daily chart of MGM. Weekly charts and daily charts are not kinda synchronized as compared to the October 2010 period. Not a good sign? Maybe...


I will definitely trade what i see but something just doesn't feel right at this moment.. I am on my guard now. Trade what you see.
Recommendation: Go to cash position.


Wednesday, 13 April 2011

Mighty Silver - At important reversal pivot point ?

Super huge volume on reversal candlestick pattern for Silver... 
And shorted Silver i did... via ZSL (Proshares UltraShort Silver ETF)


Tuesday, 12 April 2011

Mighty Silver

I was stopped out of the ZSL trade about 2 weeks ago. ZSL is a short silver ETF. At that point in time my analysis was that they were high probability trades going by the volume and price action but lo and behold... Never said never in the stock market. I always adopt this mentality when placing trades that : "I am going to be wrong most of the time". If the inevitable comes and the loss has to be taken, take it and move on!

Just when you had given up on this trade, another signal appeared. What do you do now? We do not throw in the towel yet. If your style of trading prompted that its a signal (high volume with reversal candlestick) you should take, then you should not give this trade a pass. For all you know, this trade might work out. I'll said: take this signal again and buy ZSL the next trading day with stop loss at the low of the bullish piercing candlestick spotted at closing today. Note the huge volume which was even higher than the previous trade i took about 2 weeks ago. Golly....


Short Sliver ETF (ZSL):


Monday, 11 April 2011

Trade what you see

Trade what you see. All traders are always encouraged to adhere to this golden liner. But why is it so difficult to execute? Human beings are governed by our values and beliefs in society and we are subjected to prejudices and bias. It works the same ways in trading when traders attempt to interpret price actions.

Trading is very subjective. A trader with bearish bias would see a chart differently from that of a bullish trader. Let's take a lot at two examples:

SOL (daily chart):


BAC (weekly chart): Same candlestick different interpretation.


Recommendation: The sensible and savvy trader should be on the sidelines in cash position as the stock can go either way. Careful observation of the general market trend should also be adhered to as well. He should be trading the breakout either upwards or downwards. Well... trade what you see but its really easier said than done. Discipline, patience and risk management are the 3 most important traits which we should strive to achieve.


Have a great day ahead!

Sunday, 10 April 2011

Wyckoff Method of Technical Analysis - BAC

Richard Wyckoff, one of the great traders in his days, identified trading ranges as places whereby accumulation and distribution develops to build a cause for the subsequent change of trend in movement of price actions. Trading range are places whereby there are equilibrium between supply and demand and if judged correctly, would allow traders to profit form the magnitude of the move within and out of trading ranges. Wyckoff and Jesse Livermore belong to the same era on Wall Street history but Livermore was primarily a trend follower while Wyckoff was a range trader

I came to know of Wyckoff's method of technical analysis when I came across "The Three Skills of Top Trading" by Hank Pruden whereby the Wyckoff schematics of accumulation and distribution were covered extensively by the author. Fantastic read! This book is a must read !

Here i will attempt to explain the anatomy of the trade for Bank of America (BAC) using Wyckoff's trading method.


 Abbreviations used:

Selling Climax (SC): the point at which widening spread and selling pressure (high volume) usually climaxes and panicky selling by public is absorbed by professional interest at prices near bottom.

Automatic Rally (AR): Relief rally where short-covering can easily cost prices to shoot up

Secondary Test (ST): A retest of the area of selling climax to test the supply and demand at these levels. For a bottom to be found, volume and price spread should be significantly diminished as market approaches support.

Sign of Strength (SOS): Advance on high volume and price spread

Last Point of Support (LPS): The ending point of a reaction or pullback where support was met, also known as a retest of support where long position can be initiated or to add to profitable ones.


Have a good weekend!


Thursday, 7 April 2011

United Steel (X) & MGM Resorts International (MGM)

Looking at the weekly charts of both X and MGM, one cannot help but feel that prices are indeed going to break higher for now unless the lower channel trend line of both stocks are violated. While it may seemed too premature to said that the both stocks are now forming the last leg of the lower lows of the bullish triangle on the weekly charts, one cannot deny the fact that the bull run is pretty much intact. The charts do not lie.


United Steel - X


MGM Resort International - MGM
MGM looks to be a low risk buy now based on weekly charts.


Wednesday, 6 April 2011

BUY BUY BUY Financials !!

Financial stocks are starting to move. Do note that they have yet to take part in the stock market rally so far. In addition, cup and handle patterns were detected on their weekly charts. See earlier post here.

See BAC and FAS chart for today thus far (note that trading is still on at time of post).


Tuesday, 5 April 2011

WFR - Trading off weekly and daily charts

MEMC Electronic Materials (WRF) is another stock which is on my watchlist. Look at its beautiful weekly chart. I am so very excited on this stock. WFR broke its downward trendline in end Jan 2011 on heavy volume and tested the top resistance of the Ichimoko Clouds before moving down to its support at the base of the clouds. A change of trend is the most lucrative to trade if one has the patience to wait it out. This stock would be a low risk buy on a retest of support.

As the famous great trader Richard Wyckoff would put it, this stock is currently in the midst of backing up to the "creek" after its initial rally. Wyckoff said that it is normal for an advance to be corrected with a reaction to the vicinity of the halfway point of the advance. Since the halfway point is above the creek, the back up is likely to be completed between the halfway point and the top of the creek. Wyckoff also said that we will need the combination of narrow price spreads and low volume on the back up in order to take up a long position. This will serve to be a primary buying opportunity.


Look for a reversal candlestick on the bottom channel of the trendline of daily chart of WFR. Only buy when it rebound... or else....


ReneSolar (SOL) - Trading off weekly and daily charts

I am currently stalking ReneSolar (SOL) using the weekly charts as a base. Let's first take a lot at ReneSolar (SOL) on the weekly charts. Stock is now bouncing off bottom channel of the uptrend line formed over 2 years. I missed the entry 2 weeks back and is now awaiting a second opportunity to build a position into the stock.


Having used the weekly charts to serve as a macro view of the overall long term trend of SOL, i will now turn my attention to daily chart of SOL to look for a good entry. For SOL, i will be looking for a reversal candlestick at around the 200day MA support. And if that fails, i will then get in at the next support via a reversal candlestick at the lower channel trendline of the symmetrical triangle.

Common mistake: Of cos the tendency is to try to anticipate the price at the support. If you are purely just looking at daily charts, its impossible to identify the area until the end of day when the candles are formed unless you are able to combine the 15min and hourly chart.

Having said that, trying to pick a bottom using 15min and hourly chart would result in many small losses over the long run but the reward ratio is definitely higher though. Personally, i think that traders using daily and weekly charts should refrain from looking at 15min charts or less as it will influence their decision to do quick trades and thus miss out the big swing.

Patience, my friends.


Asian Indexes updates - Weekly Charts

I am not going to stand opposite the powerful weekly traders using weekly charts for a change. Asian Indexes are exhibiting strength as they have already bounced off the 50day MA on weekly charts. Let's concentrate on what the weekly charts are saying.


Singapore Straits Times Index - Currently testing Kijun line of Ichimoko Clouds. Showing strength.


Hang Seng Index - Closed above Kijun line of Ichimoko Clouds. Showing strength.


Shanghai Stock Exchange Composite - Bouncing off Ichimoko Clouds. Showing strength.