Sunday 27 November 2011

Apple Inc. - As the leader goes, so goes the market?

Apple Inc. looks poised to test its 50day MA on the weekly chart this week. On the daily chart, Apple is in the midst of forming a potential H&S pattern. Price action had already broken its neckline and is now testing its last major support at the 200day MA.

Click to enlarge


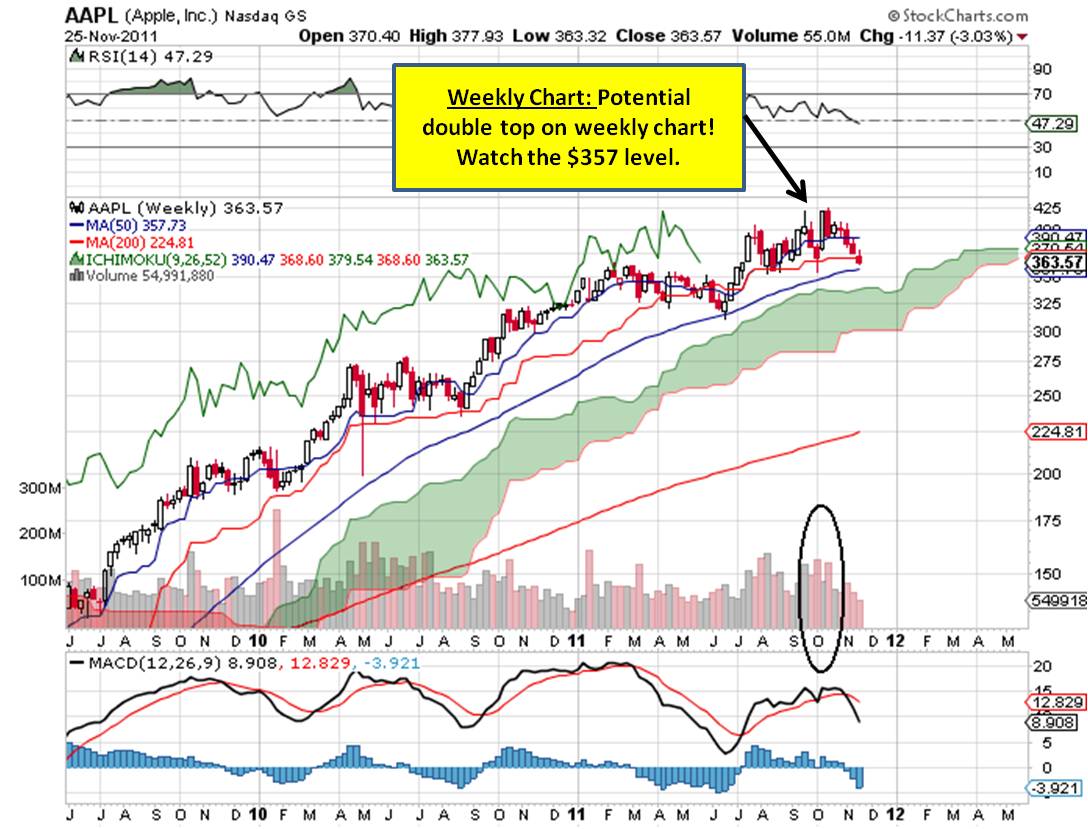
On the weekly chart, Apple had a potential double top formation with spikes in volume. A break of the crucial $357 level which happens to be the neckline would see sellers coming in.

Click to enlarge

Thursday 17 November 2011

Market Sentiment Looking Increasingly Bearish - 17 Nov 2011

Ironically, I was harping on and on about the market being bullish for the past few weeks. Somehow, the charts are showing more footprints of sellers than buyers in this current moment. Being nimble and flexible is the key to survival. Go to cash or start looking for short-selling setups.


Click on chart to enlarge - Visa Inc


Click on chart to enlarge - US Steel Group


Click on chart to enlarge - Bank of America


Sunday 13 November 2011

Market Updates - Odds with the bulls

Both Dow Jones and S&P500 are still stuck in a symmetrical triangle pattern with a breakout on the cards soon. The odds are favouring the bulls as Dow Jones had already moved above its 200day MA. It is at this point in time that we must be flexible and trade the breakout on either direction of the move. I am currently on the bull side as my interpretation is that a mini bull run is on the cards towards the end of the year. However, we must remember that the market is designed to fool investors and traders alike. Flexibility in jumping from either camp is absolutely crucial. Be nimble.

Dow Jones Index


S&P500


Direxion Financial Bull ETF (FAS)


Tuesday 8 November 2011

As Bullish as it can gets

The charts are very bullish indeed. Look at the S&P index. It looks like its going to make a new high very soon as it bounce off the top of the Ichimoku Clouds and is now aiming to clear the 200 day MA in its second attempt. Will it succeed? A break of the 200day Ma could see the index moving higher in a powerful move.

Click on charts to enlarge (S&P500)


Click on charts to enlarge (United Steel)


Click on charts to enlarge (YGE)


Click on charts to enlarge (AIG)


Click on charts to enlarge (BAC)

Always trade with stop loss.

Wednesday 2 November 2011

Bias towards Bulls - Market Updates 2 Nov 2011

A pullback is inevitable after a strong run in recent weeks. Here is the support level for S&P500. Bias is to the upside if support at 1120 region holds. The bulls need a CLOSE above this level in order to resume the upside move.1273 region serves as strong resistance.

On the daily chart, the pullback or selling retraced all the way to the top of the Ichimoku Clouds after hitting the 200day MA. Top of Ichimoku Clouds served as strong support where buyers who missed the earlier rally up would hopefully pile in to support the prices.

S&P500 Daily Chart


S&P500 Weekly Chart